
Team ownership & profit protection
Small Leaks, Shared Responsibility
Build a restaurant team that thinks like owners through open communication, clear accountability, ongoing coaching, recognition and shared rewards.
Read the Article ↗Practical consulting from an operator’s perspective.
With more than 25 years in restaurant operations, I help operators examine food cost, labor, menu performance, purchasing and everyday execution. We’ll use your actual numbers and priorities to identify practical opportunities for a stronger business.
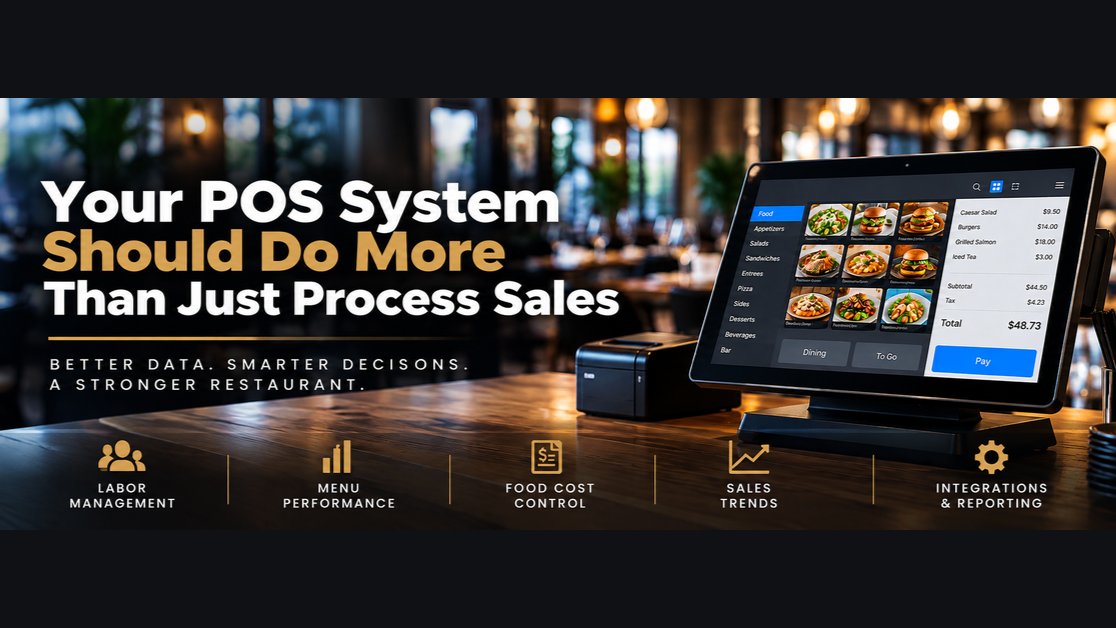 Articles & Operator InsightsPractical perspectives for your operation
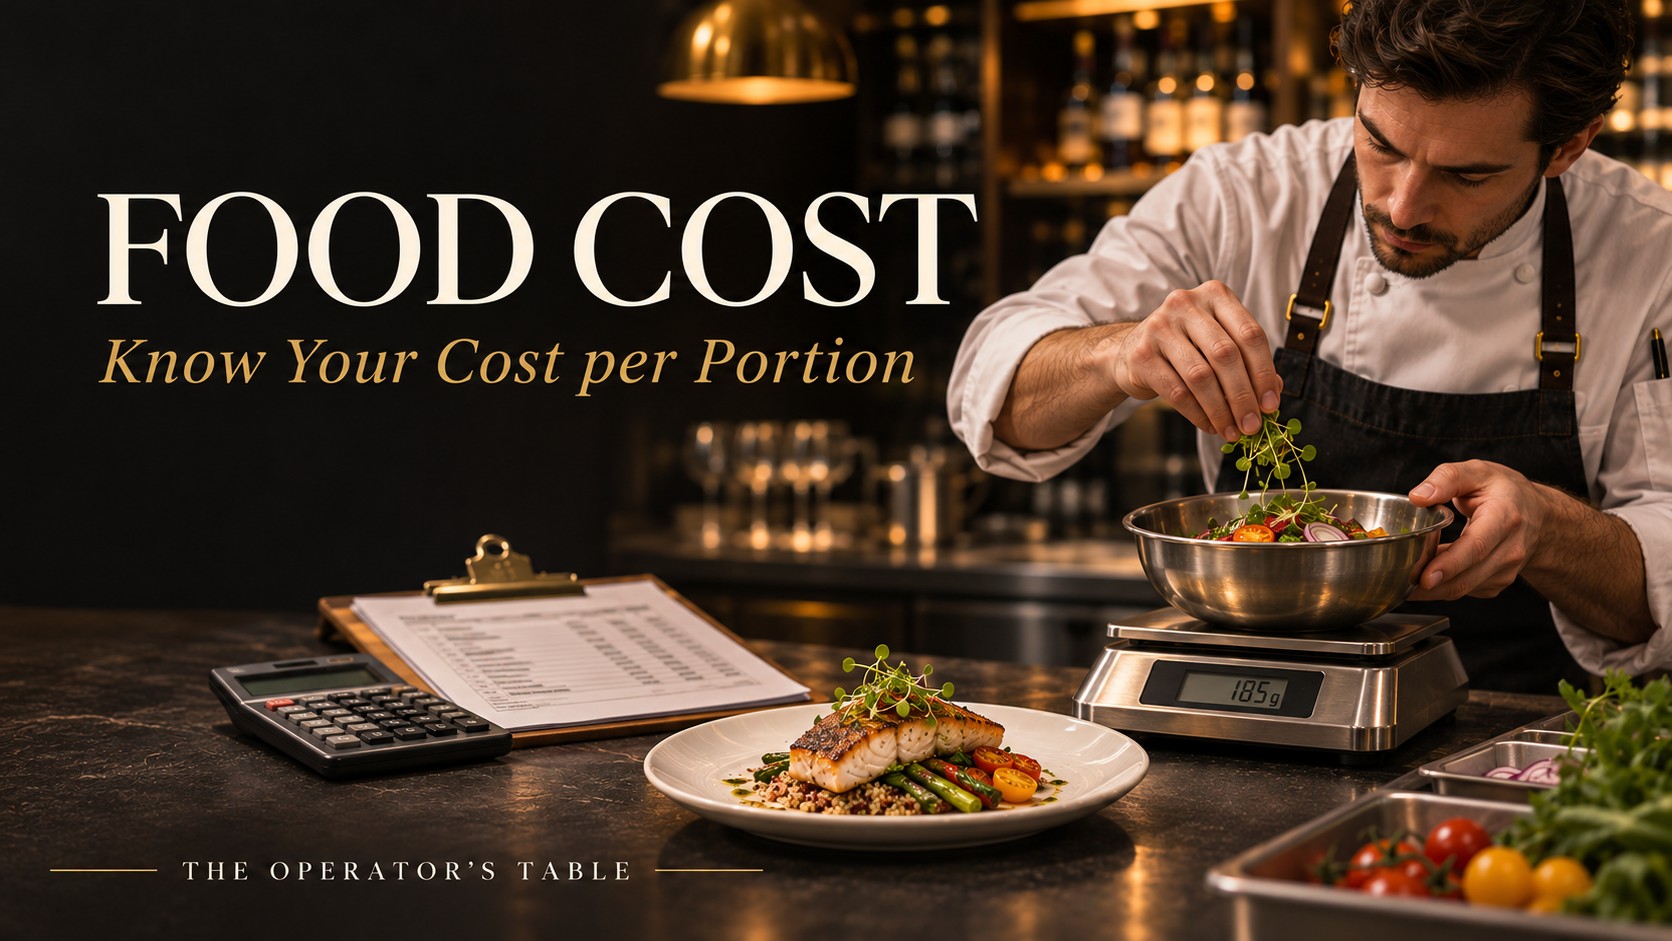 Food Cost CalculatorCompare ingredient, labor and portion costs
 Labor Percentage CalculatorHourly, salary, benefits and all-in labor
 Operating Expense CalculatorReview overhead and expense targets
 Marketing ROI CalculatorMeasure campaign contribution and guest acquisition
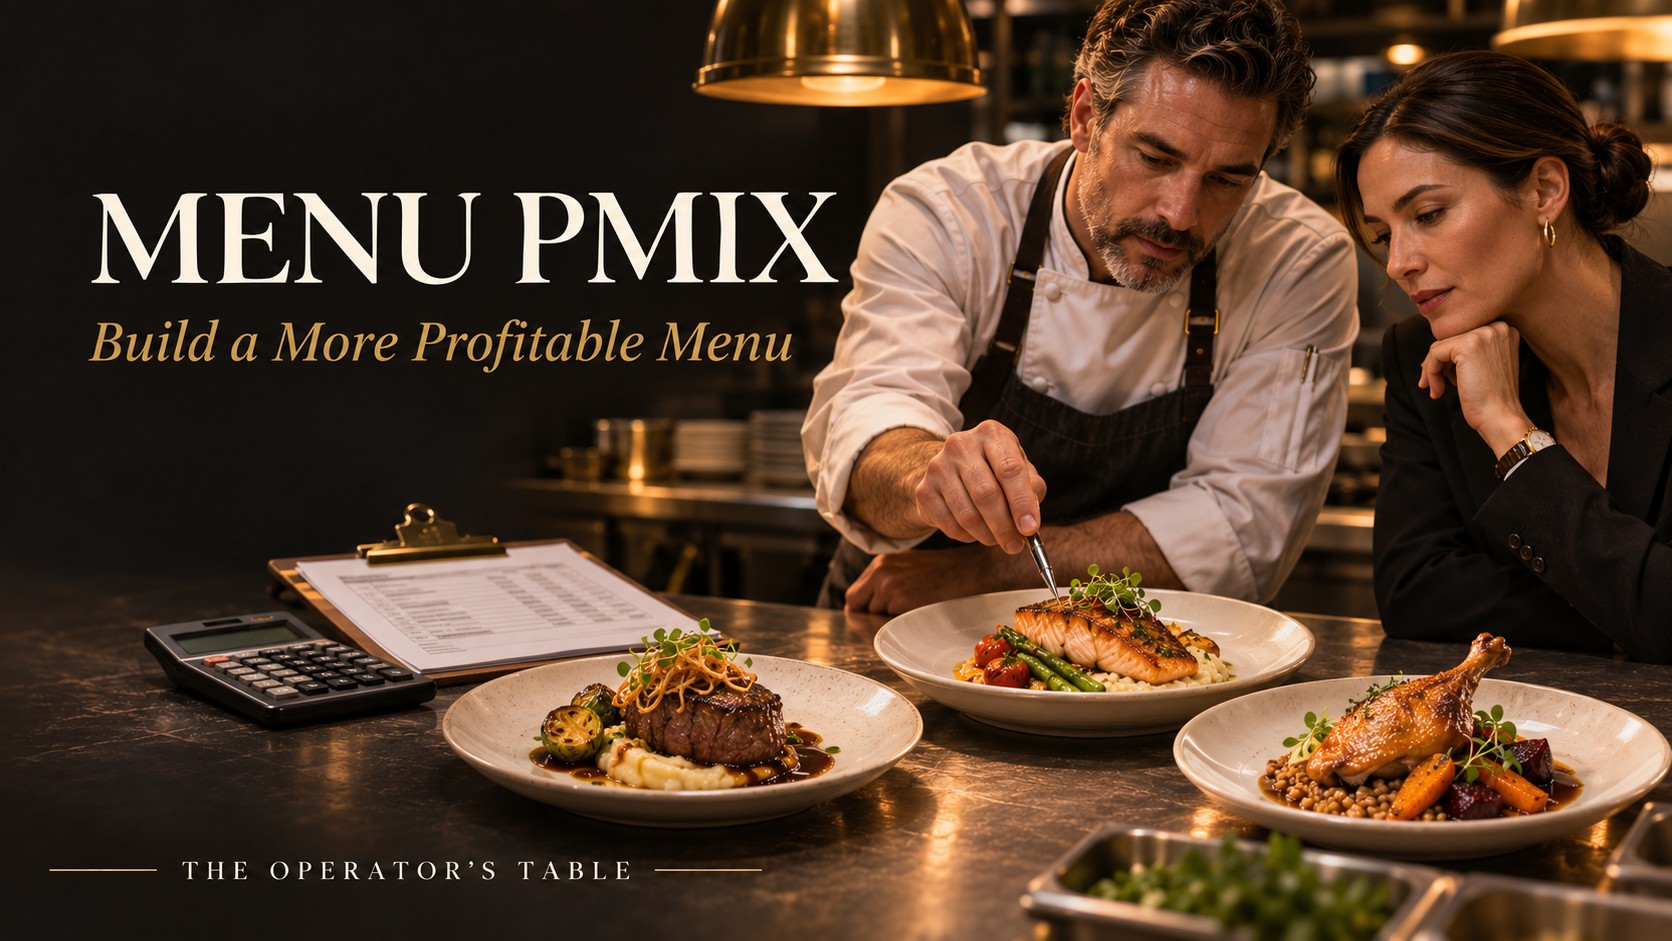 Menu PMIX OptimizationImprove contribution dollars
 Jeff's TakeMarket trends and purchasing insights
Practical perspectives on the decisions that shape restaurant performance. Read Jeff’s articles here and on LinkedIn.
Build a restaurant team that thinks like owners through open communication, clear accountability, ongoing coaching, recognition and shared rewards.
Read the Article ↗
Jeff Fritz on clear communication, shared understanding, and management’s responsibility to validate that restaurant systems are followed every shift.
Read the Article ↗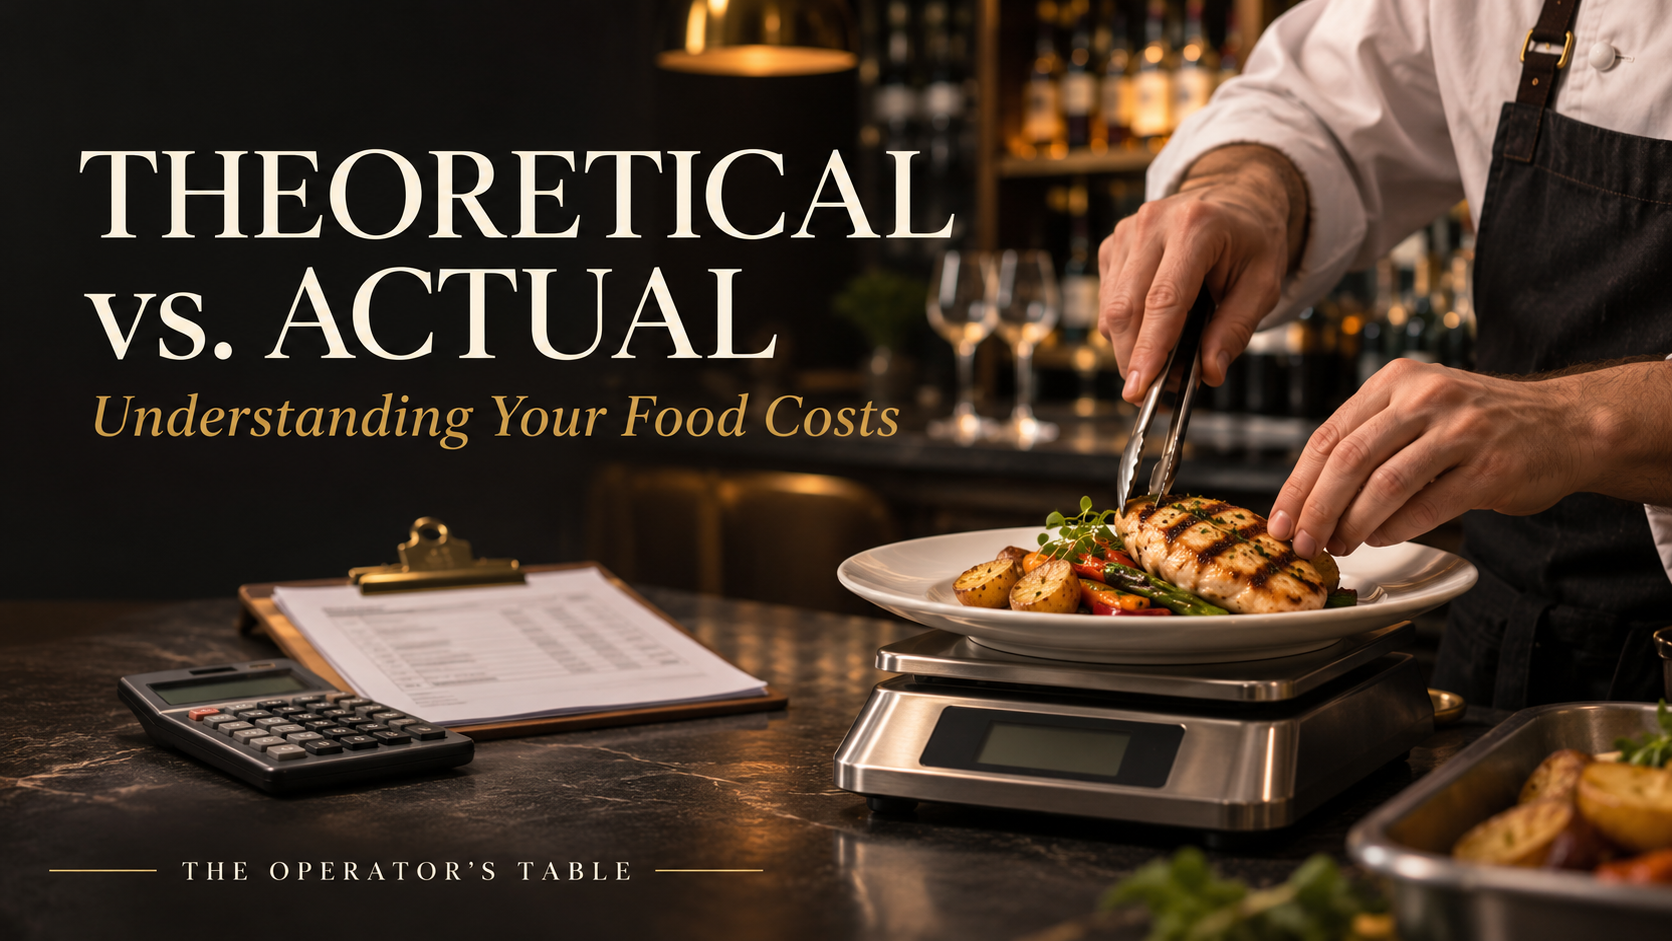
Understand theoretical and actual costs with a complete plate-costing example, sales mix calculations, and practical controls for food, liquor, wine and beer.
Read the Article ↗
Understand rent, CAM charges and total occupancy costs to protect long-term profitability.
Read the Article ↗
Jeff Fritz on understanding operating costs, protecting profitability, and giving guests a reason to return as menu prices rise.
Read the Article ↗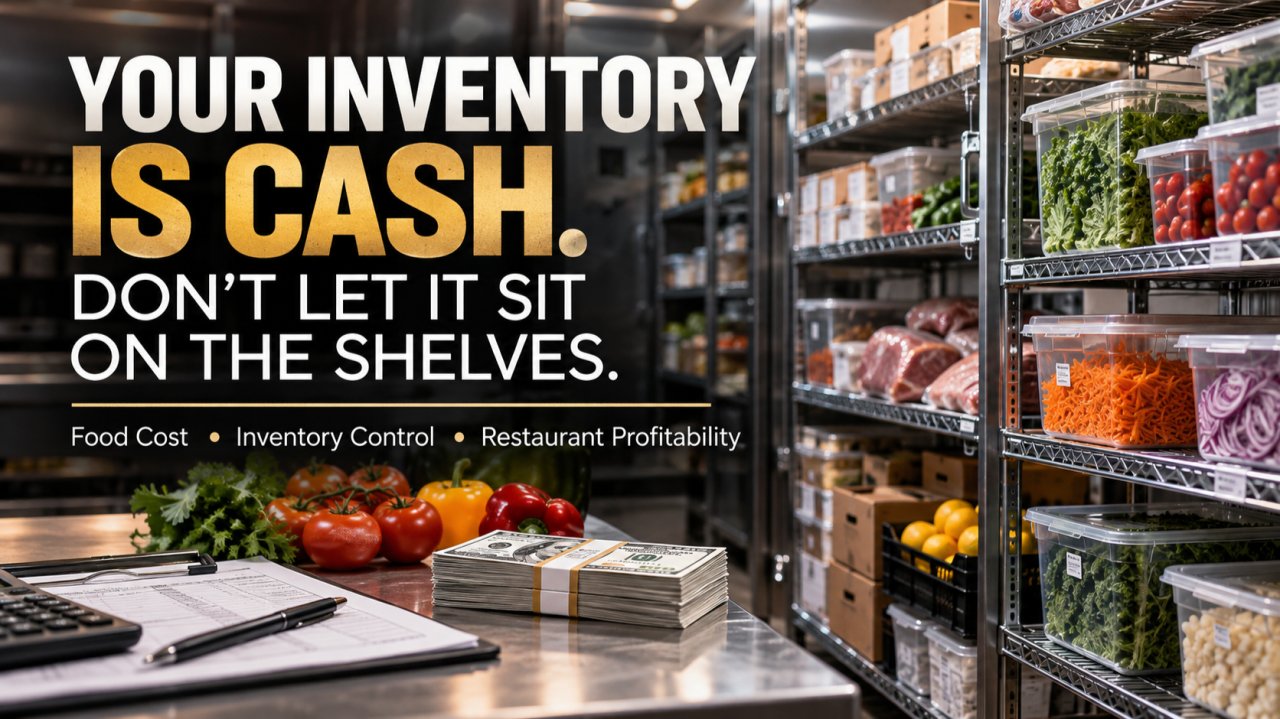
Explore the connection between food cost, ordering and cash tied up on the shelves—and why inventory discipline matters to a restaurant’s profitability.
Read on LinkedIn ↗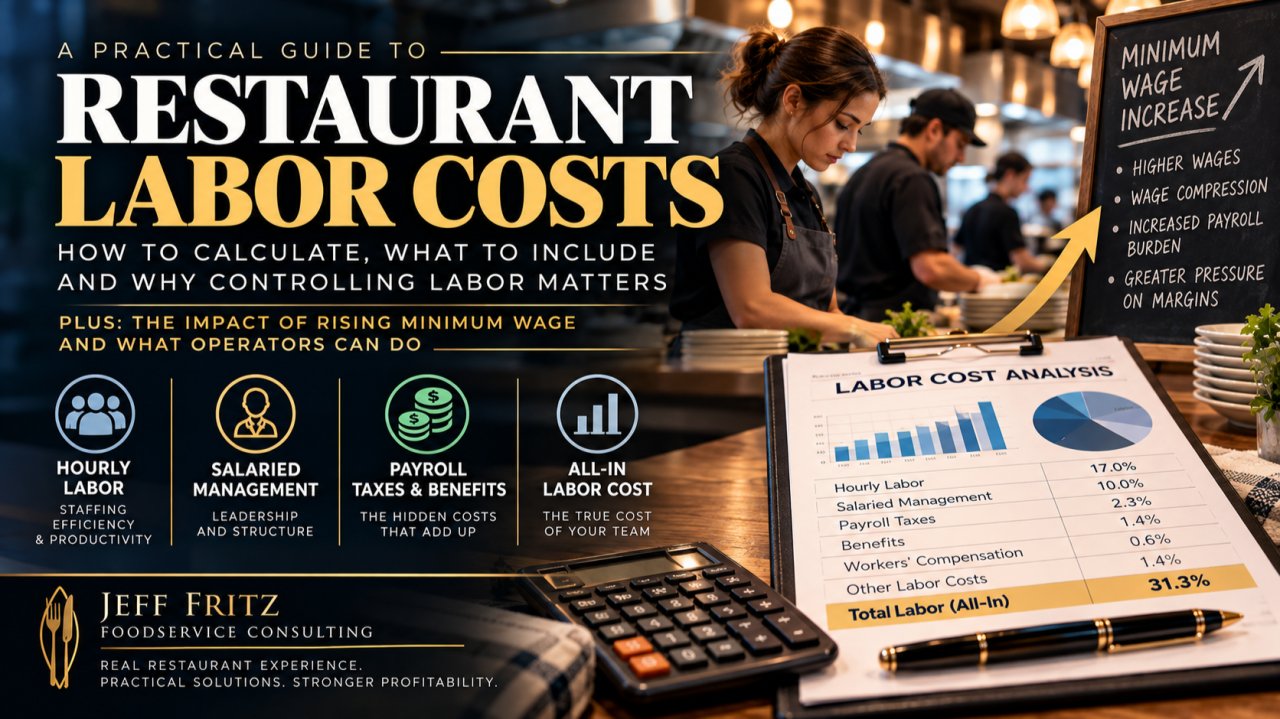
Explore the full cost of labor, from wages and salaries to payroll taxes and benefits, and why managing labor supports profitability and a strong team.
Read on LinkedIn ↗
Find the right marketing channels, grow guest counts and measure whether your investment is generating profitable business.
Read the Article ↗Consider how your POS supports decisions about labor, menu performance, food cost and sales trends—and how its reporting and integrations fit your operation.
Read on LinkedIn ↗
Look beyond added sales to the costs of platform fees, packaging, payment processing and fulfillment when evaluating delivery’s contribution to your business.
Read on LinkedIn ↗
Explore the difference between promotional traffic and lasting guest loyalty, and how to measure whether offers contribute to profitable growth.
Read the Article ↗LinkedIn articles open in a new tab and may require sign-in.
Enter two products with the same intended portion. This quick comparison includes usable yield and optional prep labor. It does not include freight or differences in quality.
Example values are shown. Replace them with your own costs, yields and prep time.
Enter hands-on prep minutes for one finished portion. Include wages, payroll taxes and benefits in the hourly cost if known.
Total includes food and prep labor at the entered hourly cost.
Build ingredient costs with usable yields, weight recipes by quantities sold, and compare theoretical cost with actual inventory usage. Analyze food, liquor, wine and beer separately, then see total variance and the remaining unexplained difference.
Open the Theoretical vs. Actual Cost CalculatorIncludes recipe costing, a worked example, device saving, CSV export and print/save-to-PDF. Your entries are not submitted.
Calculate hourly wages, salaried labor, employer payroll taxes and employer-paid benefits as separate percentages of net sales. Include optional workers’ compensation and other labor costs to see your all-in labor percentage.
Open the Labor Percentage CalculatorUse matching sales and labor periods. Includes CSV export and print/save-to-PDF. Your entries are not submitted.
Compare rent, utilities, insurance, repairs, smallwares and six other expense categories with adjustable planning benchmarks. Enter monthly or annual costs to see percentages of sales, variances and hypothetical reductions to your chosen targets.
Export your analysis to CSV for Excel or print and save it as a PDF. Calculations run in your browser; your financial entries are not submitted.
Open the Operating Expense CalculatorBenchmarks are illustrative and should fit your concept, location and accounting practices. This tool covers listed overhead expenses, not a complete restaurant P&L.
Estimate campaign contribution, marketing ROI, customer acquisition cost and the guest visits needed to break even. Include the food and variable expenses tied to incremental sales for a clearer view of performance.
Open the Marketing ROI CalculatorResults depend on your estimates and campaign attribution. Your entries stay in your browser.
Price and food cost are only part of the story. Look at how often an item sells, what it contributes with each sale, and what it asks of your kitchen and inventory.
Start with menu price minus direct item costs, including food and any per-order packaging or other variable cost you track. Multiply that amount by units sold in the same period.
Example: an $18 entrée with $6 in direct costs contributes $12 per sale. At 100 orders, that is $1,200 in contribution dollars before shared expenses.
Use the POS product mix (PMIX) to compare units sold and total contribution dollars within each menu category. A high-margin dish needs orders; a popular dish with thin dollars may need a portion, recipe or price adjustment.
Use core proteins, produce and sauces in more than one distinct dish when the fit is right. Shared ingredients can simplify purchasing and prep while reducing the risk that a one-off item spoils before it sells.
Balance signature items and dependable favorites with options that serve different tastes and occasions. Review look-alike dishes that add inventory and labor without bringing meaningful new demand.
Before cutting a guest favorite, look at the traffic it brings and what guests order alongside it. Test one change at a time, then watch orders, contribution dollars, waste and guest response.
Monthly report summaries and current USDA resources for beef, poultry, pork, seafood and produce. Check each report’s date and compare its market context with your delivered quote, product specification, usable yield and menu mix.
AMS October 30, 2026 · ERS October 16, 2026
Choice boxed beef eased late in October, while ERS still expects constrained beef production. Compare cuts and usable yield before committing to holiday purchases.
AMS October 30, 2026 · ERS October 16, 2026
Whole-bird pricing was nearly unchanged from the prior week. ERS raised broiler production expectations; compare individual cuts rather than treating chicken as one market.
AMS October 30, 2026 · ERS October 16, 2026
The weekly pork cutout moved lower. ERS also reduced production forecasts, so today’s purchasing opportunities should be evaluated against future supply risk.
ERS Food Price Outlook October 23, 2026 · September CPI/PPI data
USDA’s broad fish and seafood outlook signals ongoing price pressure. It is a retail outlook, not a species-specific wholesale quote; obtain current item pricing.
AMS October 27, 2026 · Prices October 26 versus October 19
AMS reports rain-affected California strawberries with higher prices, while some citrus markets softened. Use commodity, origin, grade and pack details rather than a single produce trend.
| October market review | Foodservice purchasing and profitability
Latest reports verified for this edition: USDA AMS October 27–30 and ERS October 16–23. Report links may advance to newer releases after publication; dates below identify the editions summarized.
AMS October 30, 2026 · ERS October 16, 2026
The October 30 AMS report shows a lower Choice cutout than earlier in the week. That short-term relief sits alongside ERS’s October outlook for a slow slaughter pace and reduced beef production forecasts. A softer daily benchmark does not guarantee a lower delivered quote.
Purchasing takeaway: Review portions, trim losses and alternative cuts; confirm your own specification and delivered price.
Sources
AMS October 30, 2026 · ERS October 16, 2026
AMS’s October 30 weekly report covers October 26–30 and shows whole-bird pricing broadly steady. ERS raised projected broiler production for 2026 and 2027. Cuts and bird sizes still move differently, so a category-wide trend is only a starting point.
Purchasing takeaway: Compare breast, dark-meat and whole-bird applications by usable cost per portion, including prep labor.
Sources
AMS October 30, 2026 · ERS October 16, 2026
AMS’s October 30 negotiated-sales report shows a lower weekly carcass cutout, with weakness across the listed primals. ERS reduced its 2026 and 2027 production forecasts following the September hog inventory report. Near-term price relief and tighter prospective supply can coexist.
Purchasing takeaway: Price-test pork features against current invoices; avoid assuming the latest decline will persist.
Sources
ERS Food Price Outlook October 23, 2026 · September CPI/PPI data
The October ERS Food Price Outlook places fish and seafood among categories with projected 2026 retail price growth above their historical average. This broad measure cannot establish the current wholesale direction of shrimp, salmon or cod.
Purchasing takeaway: Compare species, origin, size and frozen-versus-fresh specifications using current supplier quotes.
Coverage limitation: USDA does not provide a single seafood wholesale benchmark comparable to the meat cutouts. Supplemental supplier reporting could not be independently opened for verification in this refresh, so no supplier-derived species price claim is included.
Sources
AMS October 27, 2026 · Prices October 26 versus October 19
The October 27 AMS Shipping Point Trends report describes light California strawberry supplies following rain damage and higher prices, while some lemon and orange quotations moved lower. Expected movement covers October 25–November 7. These mixed conditions favor item-level purchasing decisions.
Purchasing takeaway: Approve seasonal substitutions and inspect quality on receipt; compare the same origin, grade, size and pack.
Coverage limitation: produce has no single meaningful wholesale benchmark comparable to meat cutouts. Shipping-point and terminal-market quotations represent different locations and trading terms.
Sources
Late-October beef and pork benchmarks show opportunities, but supply outlooks still call for discipline. Poultry supports menu flexibility; seafood and produce require attention to the specific item. Convert favorable quotes into better contribution dollars through yield, portion control and a flexible menu mix.
Review your 10 highest-volume ingredients weekly. Compare current and previous invoice prices, calculate usable cost per portion, and identify one purchasing or menu adjustment. Record quality and yield alongside price before deciding whether the change improves contribution dollars.
Sources and methodology: USDA AMS boxed beef and weekly chicken/pork reports dated October 30, 2026; AMS National Shipping Point Trends dated October 27, 2026; ERS Livestock, Dairy, and Poultry Outlook dated October 16, 2026; and ERS Food Price Outlook updated October 23, using September CPI/PPI data. Summaries are category context, not forecasts of your invoice cost. AMS wholesale, FOB shipping-point and reported delivered market benchmarks are not your restaurant’s delivered case price. ERS retail price outlooks are not wholesale quotes. Operator takeaways are Jeff’s purchasing guidance inferred from these reports. No supplemental non-USDA price data is used in this edition. Links checked November 1, 2026.
Report dates and release schedules are shown by USDA on the linked pages. These source reports update independently of this site. For a product-specific comparison, share your current specification, pack size and delivered price with Jeff.
Choose a focused review or discuss a broader engagement. We’ll agree on priorities, available information, scope and deliverables before consulting work begins.
Review product specifications, yield, portion costs, waste and purchasing practices using your existing suppliers and operating data.
Examine menu PMIX, contribution dollars, pricing, ingredient utilization and variety to support profitability and guest appeal.
Assess prep routines, scheduling, staffing needs, consistency and operating expenses for improvements your team can put into practice.
Recommendations are grounded in the information you share. We’ll prioritize opportunities, define a practical next step and discuss how to assess results.
Consulting starts at $150 per hour. Fixed-fee engagements are available following a complimentary introductory conversation.
Dear Owner/Operator,
After more than 25 years in restaurant management and operations, I understand the pressure of balancing food cost, labor, purchasing, staffing, menu pricing and guest expectations.
My consulting approach starts with listening. We’ll look at your operation, the challenges you face and the goals that matter to you. Then we’ll examine the information available and identify practical improvements worth testing.
That may mean comparing usable yield and portion costs, evaluating menu contribution, putting ingredients to work across more dishes, reducing waste or improving staffing and prep routines. Each recommendation should make sense for your business and the experience you want to deliver.
If your current approach is serving you well, I’ll tell you that too. My aim is useful, candid advice and a clear path toward better decisions.
Jeffrey C. Fritz
Career Operations Executive · Restaurant Operations Consulting
A lower price per pound matters only after you account for the usable product and the portion that reaches a guest.
If a $4.10 product yields 75% and a $4.25 product yields 82%, the more expensive case can produce a less expensive serving. Also compare quality and consistency, since a product that causes rework or guest complaints has costs a simple worksheet misses.
Prep intensive items can be expensive in a kitchen where every labor hour counts.
Measure the time from delivery to service, including trimming, portioning, cleanup and training. Then compare the added product cost with labor saved and consistency gained. Test the finished dish before making the switch.
One sharp price can distract from higher costs elsewhere in the order.
Review regularly purchased proteins, produce, dry goods, paper and chemicals together. Compare delivery reliability, minimums, substitutions and credits too. The best purchasing decision serves the operation across the week, not just one line of an invoice.
Systems only work when every staff member understands and follows them. Give your team clear standards, communicate expectations, and validate execution on every shift.
Build consistent operating systems for opening, service, closing, food safety, inventory, labor, waste control and guest recovery. Adapt role-based checklists to your concept, document standard responses, capture manager sign-offs, and track coaching, recognition and recurring gaps.
Use a visual dashboard to run role-based checklists, record manager sign-offs, document standard responses, and track coaching and follow-up actions.
Use the same browser on the same computer. A central office computer is a practical place to run this tool. Records are saved only in that browser profile at this website address and are not uploaded or synced. Anyone using that profile can access them. Avoid private/incognito mode and export backups regularly: clearing browser data can erase records. Use Export Backup and Restore Backup to move or recover your records.
Download the 12-page pack covering all eight operating areas, shift briefing and manager sign-off, standard responses, coaching and follow-up forms. No account required.
Download Printable Checklists (PDF)Customize the standards for your operation and keep completed forms securely in your office.
Explore business resources from Strategy 360 Group, including opportunities to learn about supplemental insurance and other financial solutions for businesses and their teams.
Strategy 360 Group is committed to providing high-quality products and services and helping businesses of all sizes succeed with the tools and support they need to thrive in a competitive market. The group believes every business owner deserves access to expert tax strategy and financial guidance—not just Fortune 500 companies.
High ethical standards in every client engagement.
Decades of combined experience in business tax strategy and financial planning.
A focus on tangible outcomes for clients.
Working alongside clients as a trusted advisor.
Jeff Fritz represents Strategy 360 Group.
Let’s identify opportunities to improve your business through focused, practical operations consulting.
Let’s start with your priorities: food cost, prep labor, menu performance, purchasing or the challenges you face every day.
A focused 15–20-minute conversation to identify potential improvements in yield, purchasing, menu contribution or ingredient utilization.
We’ll start with one or two priorities and the information you can share, such as a product specification, recent invoice or menu item cost. The review highlights opportunities worth investigating; any savings need to be assessed against your actual costs, quality, labor and operating needs.
Consulting starts at $150 per hour. Fixed-fee engagements are available following a complimentary introductory conversation.
Jeffrey C. Fritz
St. Louis, Missouri